 |
| Data and Monitoring Panel |
|
 |
| Control Chart Button |
Click on the Control Chart button to display the quick control chart.
Quick Control Chart consists only pre-determined Upper Control Limit (UCL), predefined Lower Control Limit (LCL) and value (individual or average and moving range or range or standard deviation). If the UCL and LCL are not defined yet, it won't be shown in the control chart. Pre-determined UCL and LCL can be set at the SPC Panel.
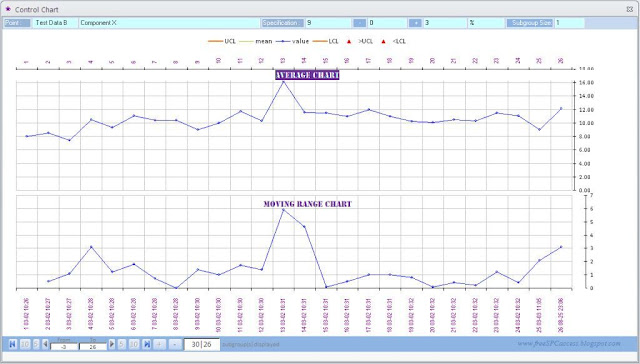 |
| Control chart without predetermined control limit |
|
|
|
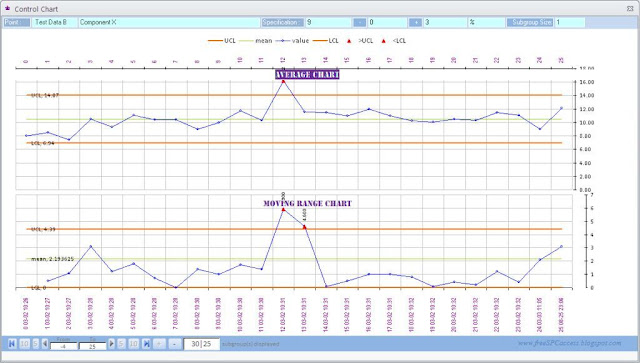 |
| Control chart with predetermined control limit |
By default the chat will show the latest 30 subgroups.
Click on navigation buttons so see previous or next subgroups.
Click + or - button on the navigation to increase or decrease number of subgroups displayed on the chart.


